

Changelog Nov 20, 2026 - Every run's filters in scan history, and breadth on the scanner
Open any run in scan history to see its filters as scanner rows and load it again. A saved scan's breadth now sits beside Edit, and the scan builder keeps your comments and values through more edits.
 Eoin3 min read
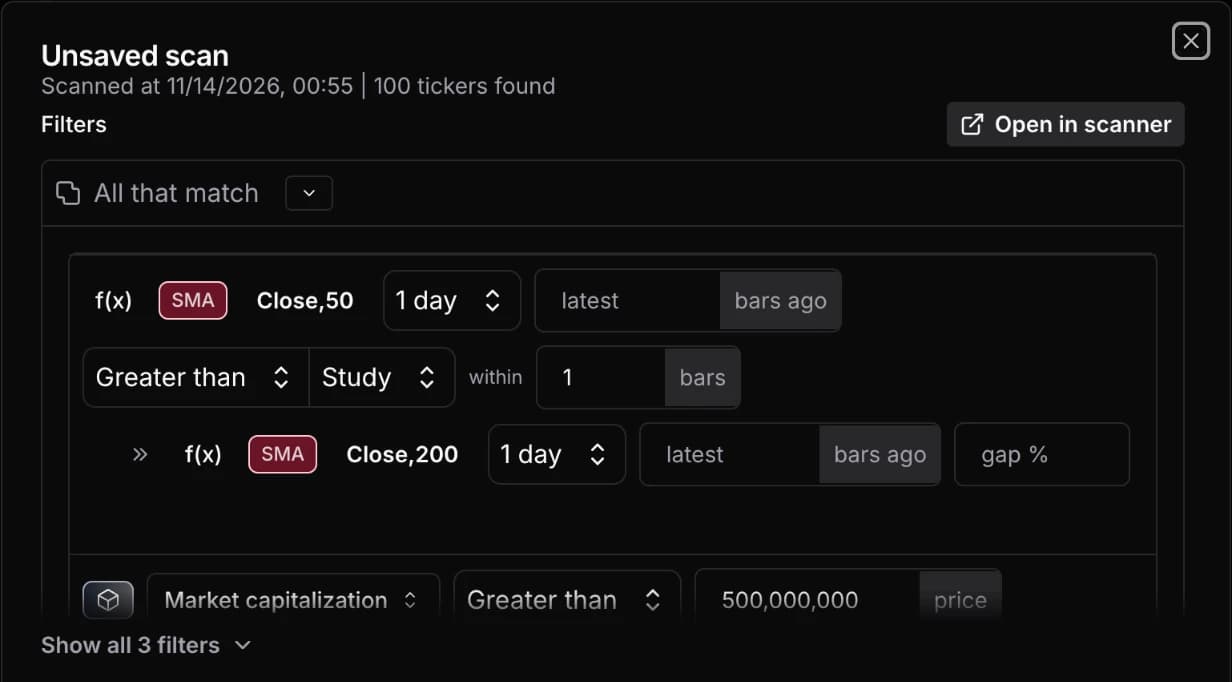
You can now open any run in your scan history and see the filters it used, drawn the way the scanner draws them. A saved scan's breadth line sits beside Edit on the scanner. Most of the rest of this release fixes the scan builder: comments and values that used to vanish during an edit now stay put.
Scan history shows each run's filters
Open My Scans, then All scans, and click a run. The window shows that run's filters as read-only scanner rows: the first filter in full and the top of the next one fading out. Click Show all under them to see the rest. Nested groups, chart patterns, pattern models and bar filters all draw, where the old list of sentences gave up on them.
Before this release, the window looked the run up by its saved scan's name. For an unsaved scan, or one you'd renamed or deleted since, it showed "Scan not found". It now builds from the run itself, so every run opens. Open in scanner loads that run's own filters and runs them, for saved and unsaved scans. The ticker list under the filters loads now too. It came back empty for every run before.
Breadth on the scanner and on scan details
With a saved scan open in the scanner, its 30-day breadth sparkline now sits beside the Edit button. Breadth is how many tickers the scan matched each day. The line updates after each run, and clicking it opens the same chart as the Breadth column on My Scans. It stays hidden until the scan has a run, and when the scanner panel is narrow.
A scan's details page had two cards that charted the same thing. It now has one, Daily Activity (Breadth), with a dashed line on each day you changed the scan's filters. A jump on one of those days may come from your edit, not the market. This card is on Super and Super Pro.
Fewer surprises in the scan builder
- Changing what a row is (another indicator, metric, study or pattern), moving it to another group, or resetting it to its default keeps the row's comment.
- Reset to default on a numeric stock row now resets it. It used to put the old value back.
- Switching an indicator row to Range starts from a range that matches
stocks.
> 70becomes> 70and<= 99, where before it became> 70and< 70. Scans you already saved keep their stored values. - A saved scan you edit and then set back to its saved values no longer reads as edited.
- Typing a decimal into Bars ago or Within rounds it to a whole bar instead of crashing the builder.
- Saved scans with an insider-transaction filter load and run again.
Also in this release
- Chart settings have a Dollar volume option. Turn it on and the volume bars show dollars traded (close × shares) instead of shares, so you can compare volume between a $5 stock and a $500 one. The legend shows it as $ Volume. It saves with your chart presets.
- Charts draw indicators when you're signed out, on daily bars and longer, 15 minutes delayed. On the Free plan, intraday indicators reach back one session, matching the intraday bars Free already gets.
- Signed in, a preset page on scanr.ai/scanners shows the run your plan would get in the app. If your plan runs the preset, that's the latest run with no delay.
- The Top Tickers card on a scan's details page loads again.
- Past a filter's lookback limit, the upgrade link names the plan that allows that value instead of always saying Super.
- A long intraday ticker chart with live bars no longer runs Chrome out of memory.
- The Negative and Positive swatches in the sentiment history legend show their colors.
- AI assistants that connect to mcp.scanr.ai with strict OAuth checks can sign in.
- On mobile, the ticker chart draws the whole window you pick: daily Max shows all five years, and intraday goes back up to 1,500 bars. Holding a finger on a live chart keeps the legend up, and the alert composer's preview shows only the heading and the sample push, as on the web.
Tell us what you'd like to see next, or anything you run into, on the feedback board or at [email protected].
— Eoin & The Scanr.ai team