

candlestick scanner
Shooting Star Candlestick Stocks
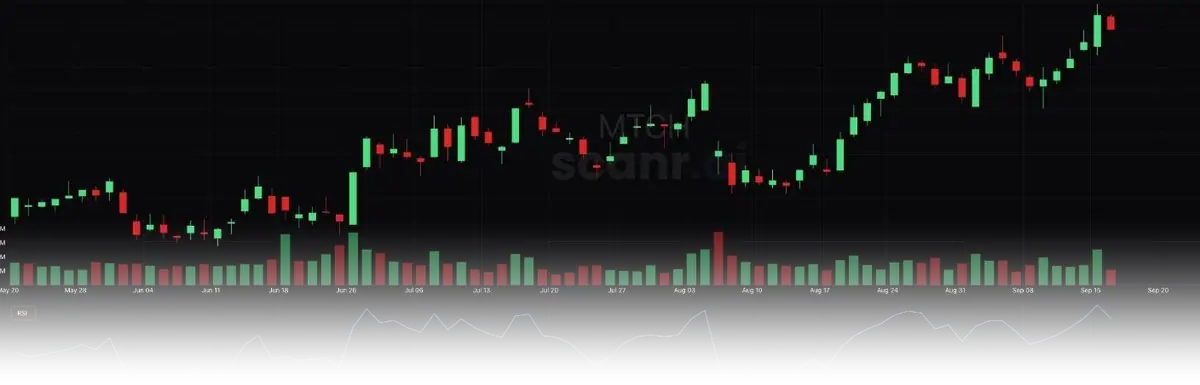
A shooting star is a hammer inverted: a small body with a long upper shadow, formed when a session rallies hard and gives all of it back by the close, with sellers meeting the advance and winning. This scan finds shooting stars printed in the last five bars in stocks whose RSI is also above 65, so the pattern appears where a stock is already extended rather than partway up from a low, and only in names averaging more than $5M a day in dollar volume.
What this scan looks for
- Daily RSI(bar_close, 14) greater than 65
- Daily SMA(bar_dollar_volume, 50) greater than 5M
- Daily Shootingstar candlestick pattern within the last 5 bars
7 stocks match today
Updated
| Ticker | Company | Sector | Market cap | Price | Change |
|---|---|---|---|---|---|
| CAI | Caris Life Sciences, Inc. Common Stock | Services | $8.9B | $31.42 | -0.73% |
| RNG | RINGCENTRAL, INC. | Services | $6.7B | $79.64 | +0.38% |
| SG | Sweetgreen, Inc. | Retail Trade | $913.0M | $8.13 | +5.19% |
| RGR | Sturm, Ruger & Company, Inc. | Manufacturing | $670.1M | $42.04 | +0.76% |
| MG | Mistras Group Inc. | Services | $664.9M | $21.45 | +2.44% |
| HOWL | Werewolf Therapeutics, Inc. Common Stock | Manufacturing | $47.7M | $0.97 | -1.79% |
| NCPL | Netcapital Inc. Common Stock | Finance, Insurance, And Real Estate | $7.6M | $1.43 | +39.42% |
Run this scan yourself
This scan runs on the free tier. Load it as a preset, adjust any filter, and run it against live market data.
Start scanning freeRelated scans
- Hammer Candlestick StocksA hammer in the last eight bars, with RSI under 40.
- Morning Star Candlestick StocksA completed morning star in the last five bars, RSI under 45.
- Dragonfly Doji StocksA dragonfly doji in the last five bars while oversold.
- Bullish Engulfing StocksA bullish engulfing candle in the last three bars, RSI under 50.
- Three White Soldiers StocksThree consecutive up candles inside an established uptrend.
- Evening Star Candlestick StocksA completed evening star in the last five bars, RSI above 60.